Super El Niño Watch 2026
Watching the Pacific wake up — and understanding why an ocean thousands of kilometres away can influence weather across the world.
Many of you know that I used to post weather updates regularly and have also been involved in providing weather-related knowledge and technical support to Indian paramilitary forces and other government agencies.
Over time, however, I gradually stopped posting frequent public forecasts and limited most of my detailed observations to specific groups and forces.
There was a rather funny reason behind it too.
Whenever I posted a forecast, friends and others would start asking:
“When exactly will it rain in my neighbourhood?”
“You said rain was possible. Why didn't it rain at my house?”
“It was forecast as light rain. Why did it rain so heavily here?”
And eventually:
“See... weather forecasts are not accurate!”
But weather doesn't quite work like that.
A forecast describes probabilities and atmospheric conditions, not a promise that a particular street will receive rain at a particular minute. A thundercloud only a few kilometres wide can drench one neighbourhood while leaving another almost completely dry.
That is one of the most fascinating aspects of weather. Even when we understand the broader atmospheric conditions, local variations can produce remarkably different outcomes within a small geographical area.
So I stepped away from routine public weather updates.
One exception has always remained: cyclones affecting the Indian subcontinent.
Cyclones fascinate me. Watching a disturbance develop over warm ocean water, studying sea-surface temperatures, pressure, steering winds and atmospheric circulation, and then trying to understand where the system might travel is an amazing subject in itself.
And now another fascinating phenomenon is unfolding across a much larger canvas.
The Pacific Ocean has been displaying remarkable changes through 2026. Some of the oceanic and atmospheric indicators I have been following are significant enough that I thought it was time to start documenting them.
Unlike a cyclone that develops over days, El Niño evolves over months. Its influence can extend across oceans, continents and seasons.
A change in the Pacific Ocean can influence rainfall in India, drought conditions in Australia, fisheries near South America, winter weather in North America and atmospheric circulation across the tropics.
But how does that happen?
How can unusually warm water thousands of kilometres away influence the clouds forming over Chennai?
And why can the same El Niño event increase the probability of drought in one part of the world while increasing the likelihood of heavy rainfall somewhere else?
These are the questions that make climate science so fascinating to me.
A Living Climate and Weather Diary
This will not be a conventional article that I publish once and forget.
Think of it as my 2026 Super El Niño Watch — a living climate and weather diary.
I will continue documenting observations, model projections, atmospheric developments and their possible implications, particularly for India and Tamil Nadu.
The objective is not simply to predict rain. It is to understand the physical processes behind the weather we experience.
How This Blog Is Organised
Section 1 — Understanding the Science
A simple but detailed explanation of El Niño, La Niña, ENSO, Southern Oscillation Index (SOI), Indian Ocean Dipole (IOD), and their influence on weather across the world.
Section 2 — The 2026 El Niño Watch
A regularly updated record of observations, forecasts and my interpretations, with the latest updates appearing first.
I will also examine how these larger climate patterns interact with India's Southwest Monsoon and Tamil Nadu's Northeast Monsoon.
Throughout this blog, I will distinguish between actual observations, numerical model forecasts and my own interpretations.
Because in meteorology, understanding uncertainty is just as important as understanding the forecast.
Last updated: 16 October 2026
SECTION 1
Understanding El Niño, La Niña and the Climate System
1. What Exactly Is El Niño?
Imagine the Pacific Ocean as a gigantic bathtub.
This is perhaps the easiest way to understand El Niño and La Niña.
Imagine an enormous bathtub stretching thousands of kilometres from Indonesia and Australia in the west to Peru and Ecuador in South America in the east.
Under normal conditions, winds called trade winds blow from east to west across the tropical Pacific.
Imagine continuously blowing across the surface of your bathtub.
What happens?
The surface water gets pushed toward one side.
Something similar happens in the Pacific Ocean.
The trade winds push warm surface water toward Indonesia, Papua New Guinea and Australia.
Warm ocean water encourages evaporation, rising air, clouds and thunderstorms.
As a result, the western tropical Pacific contains an enormous warm-water region that supports considerable tropical rainfall.
Meanwhile, near Peru and Ecuador, some of the surface water moving away from the eastern Pacific is replaced by colder water rising from below.
This process is called upwelling.
Upwelling is particularly important because deep ocean water is often rich in nutrients that support marine ecosystems and fisheries.
Under normal conditions, therefore, the tropical Pacific has an interesting contrast:
Western Pacific: Warmer surface water, rising air and abundant tropical convection.
Eastern Pacific: Relatively cooler surface water, stronger upwelling and generally less tropical convection.
The atmosphere responds to this contrast.
Air rises over the warmer western Pacific, travels through the upper atmosphere, descends farther east and returns near the surface through the trade winds.
This large-scale atmospheric circulation is known as the Walker Circulation.
It is an important part of the tropical climate system.
And every few years, this enormous ocean–atmosphere machine changes gear.
2. Enter El Niño — When the Pacific Changes Its Behaviour
During El Niño, the easterly trade winds weaken significantly and can sometimes reverse over parts of the equatorial Pacific.
Imagine stopping the person who has been continuously blowing across our bathtub.
The warm water that was pushed toward one end begins spreading back.
In the Pacific, unusually warm surface water spreads eastward across the equatorial ocean.
The colder upwelling near South America weakens.
And, most importantly, the region favourable for rising air, clouds and thunderstorms begins shifting eastward too.
The Walker Circulation also weakens or changes its position.
So El Niño isn't simply:
“The Pacific Ocean became warmer.”
It is better understood as:
A large-scale redistribution of oceanic heat that reorganises tropical atmospheric circulation.
Because the tropical Pacific is enormous, changes in its heat distribution can influence atmospheric circulation thousands of kilometres away.
These distant climate influences are called teleconnections.
Think of throwing a large stone into a pond.
The stone falls in one location, but the ripples travel far beyond where it landed.
El Niño produces a similar kind of large-scale climatic influence, although the actual mechanisms involve atmospheric circulation, tropical heating and interactions between the ocean and atmosphere.
This is why warming in the Pacific can influence rainfall and temperature patterns in countries located far away from it.
3. Then What Is La Niña?
La Niña is essentially the opposite phase of the same climate system.
Instead of weakening, the easterly trade winds generally become stronger.
They push even more warm surface water toward Indonesia and Australia.
Cold-water upwelling becomes stronger in the eastern equatorial Pacific.
As a result, the central and eastern equatorial Pacific become cooler than their usual conditions.
The atmospheric circulation also responds.
Tropical convection tends to become more concentrated toward the western Pacific, while the Walker Circulation generally strengthens.
The Three Phases of ENSO
El Niño
Trade winds weaken → warm surface water spreads eastward → eastern and central Pacific temperatures rise → tropical rainfall and atmospheric circulation patterns shift.
La Niña
Trade winds strengthen → warm surface water is pushed farther west → colder water rises more strongly in the eastern Pacific → central and eastern Pacific temperatures fall.
ENSO-Neutral
Neither El Niño nor La Niña dominates the tropical Pacific climate system.
Together, these phases form the El Niño–Southern Oscillation, commonly called ENSO.
ENSO does not operate on a fixed calendar. Events typically recur irregularly, often every two to seven years, and their intensity and duration can vary considerably.
4. Why Are There Niño 1, Niño 2, Niño 3, Niño 3.4 and Niño 4?
Scientists cannot describe an ocean covering millions of square kilometres using one thermometer.
So the tropical Pacific is divided into different monitoring regions.
Imagine travelling from South America toward Indonesia.
You would broadly encounter the eastern Pacific Niño 1+2 region, followed by Niño 3, Niño 3.4 and Niño 4 farther west.
Niño 1+2: Located close to the South American coast, near Peru and Ecuador.
Niño 3: Covers a large part of the eastern equatorial Pacific.
Niño 3.4: Located in the central-eastern equatorial Pacific and widely used for monitoring ENSO conditions.
Niño 4: Located farther west in the central equatorial Pacific.
These regions help scientists understand where the ocean is warming or cooling and how the temperature pattern is evolving.
For example, unusually strong warming in Niño 1+2 and Niño 3 compared with Niño 4 suggests that warming is more concentrated toward the eastern Pacific.
However, an important distinction is necessary when interpreting the data.
The Australian Bureau of Meteorology introduced Relative Niño indices in 2025. These measure Pacific temperature anomalies relative to broader tropical ocean warming.
They should not automatically be compared with historical thresholds developed for traditional Niño indices.
That is why I pay attention not only to the numerical value of Niño 3.4, but also to the type of index, the temperature maps, the atmospheric response and the persistence of the pattern.
5. The Southern Oscillation Index — When the Atmosphere Joins the Ocean
Ocean temperature is only half of the ENSO story.
The atmosphere is the other half.
One important atmospheric indicator is the Southern Oscillation Index (SOI).
The SOI is calculated from differences in atmospheric pressure between Tahiti and Darwin, Australia.
These pressure differences provide information about changes in tropical Pacific atmospheric circulation.
Think of El Niño as a dance between two partners:
The ocean and the atmosphere.
Niño temperature indices tell us mainly what the ocean is doing.
The SOI helps us understand what the atmosphere is doing.
A sustained negative SOI is generally associated with El Niño-like atmospheric circulation, while a sustained positive SOI is more characteristic of La Niña conditions.
For example, if the central-eastern Pacific becomes unusually warm and the SOI also becomes strongly negative, the two indicators together provide stronger evidence of an ocean–atmosphere response than ocean warming alone.
This interaction matters because changes in tropical atmospheric circulation can influence weather patterns far beyond the Pacific Ocean.
A single daily SOI reading, however, should not be interpreted in isolation. Sustained behaviour over time is more informative.
6. How Can El Niño Affect Countries Thousands of Kilometres Away?
This is where climate science becomes particularly fascinating.
El Niño does not physically send warm Pacific water into India or Australia.
Instead, it changes where enormous amounts of heat and moisture enter the atmosphere.
That changes rising and sinking air, atmospheric pressure patterns, tropical convection and the circulation of winds at different altitudes.
These changes can influence rainfall, drought, temperature and storm activity across distant regions.
India
El Niño has historically been associated with an increased probability of weaker Southwest Monsoon rainfall.
However, El Niño does not guarantee drought in India.
Australia and Indonesia
El Niño often increases the likelihood of hotter and drier conditions across parts of Australia and Indonesia.
La Niña generally increases the probability of wetter conditions in many areas.
Peru and Ecuador
El Niño can bring unusually warm coastal waters and, during certain events, heavy rainfall and flooding.
It can also disrupt nutrient-rich upwelling and affect marine ecosystems and fisheries.
Southern Africa
El Niño is often associated with increased risk of below-normal summer rainfall in parts of southern Africa.
North America
El Niño can influence winter circulation patterns, changing the likelihood of wetter, drier, warmer or cooler conditions across different parts of the United States and Canada.
Tropical Cyclones
ENSO can influence tropical cyclone activity by changing atmospheric circulation and vertical wind shear.
For example, El Niño often suppresses Atlantic hurricane activity through increased wind shear, while La Niña can create more favourable atmospheric conditions.
These are broad climatic tendencies, not guaranteed outcomes.
A particular El Niño event does not produce identical effects everywhere, and its influence depends on the season, intensity and interaction with other climate systems.
7. But What Does El Niño Mean for India?
Here is where we need to be careful.
You will often hear:
El Niño = Drought in India.
That is far too simplistic.
El Niño has historically been associated with an increased probability of weaker Southwest Monsoon rainfall, but it does not guarantee drought.
India's monsoon is influenced by several interacting systems.
One particularly important player is sitting much closer to us.
The Indian Ocean Dipole — IOD.
8. The Indian Ocean Dipole — Another Important Climate Driver
Imagine another, smaller bathtub, this time across the Indian Ocean.
Scientists compare sea-surface temperatures in the western tropical Indian Ocean, toward Africa, with those in the eastern tropical Indian Ocean, toward Indonesia.
When the western Indian Ocean becomes relatively warmer than the eastern Indian Ocean, it is called a Positive Indian Ocean Dipole.
When the eastern Indian Ocean becomes relatively warmer than the western side, it is called a Negative Indian Ocean Dipole.
The IOD can influence tropical convection, atmospheric circulation and rainfall across countries surrounding the Indian Ocean.
A positive IOD can sometimes support India's Southwest Monsoon circulation and partly counteract an adverse El Niño influence.
But the relationship is not automatic.
The timing, intensity and geographical distribution of the IOD matter.
That's why looking at Niño 3.4 alone and predicting India's rainfall is like trying to understand a cricket match by watching only one player.
ENSO is an extremely important player.
But it isn't playing alone.
9. Chennai Has Another Twist — The Northeast Monsoon
For much of India, the Southwest Monsoon from June to September provides most of the annual rainfall.
Tamil Nadu is different.
For Chennai and much of Tamil Nadu, the Northeast Monsoon (October–December) is enormously important.
And El Niño's relationship with the Northeast Monsoon is not identical to its relationship with India's Southwest Monsoon.
Some historical studies have identified a tendency toward enhanced Northeast Monsoon rainfall over parts of southern peninsular India during certain El Niño events.
But again:
El Niño does not guarantee heavy rainfall in Chennai.
For Chennai and Tamil Nadu, I would monitor the combined influence of:
ENSO — El Niño and La Niña
IOD — Indian Ocean Dipole
MJO — Madden–Julian Oscillation
Bay of Bengal sea-surface temperatures
Easterly waves and moisture transport
Low-pressure areas and cyclonic disturbances
Atmospheric steering winds and circulation patterns
Think of El Niño as changing the background stage.
It doesn't write every scene of the play.
A cyclone or Chennai thunderstorm still requires the right atmospheric ingredients at the right place and at the right time.
10. The Madden–Julian Oscillation — A Faster-Moving Influence
Another important tropical weather influence is the Madden–Julian Oscillation, or MJO.
Unlike ENSO, which develops and evolves over months, the MJO typically moves through the tropics over a period of several weeks.
It is a travelling pattern of enhanced and suppressed tropical cloudiness, rainfall and atmospheric circulation.
When the active phase of the MJO moves into a favourable region, it can support tropical convection and sometimes create conditions favourable for the development of low-pressure systems.
Its influence is particularly interesting during the monsoon season.
However, the MJO does not independently determine whether a particular location will receive heavy rainfall.
It interacts with local moisture, winds, atmospheric instability and other circulation systems.
11. Why I Am Documenting This
I'm not starting this series to predict:
“Your street will receive 37 mm of rain at 7:15 PM.” 😂
Quite the opposite.
I want to use this developing climate situation to explain how weather and climate actually work.
We will watch the ocean.
We will watch the atmosphere.
We will look at sea-surface temperatures, Niño regions, SOI, IOD, MJO, winds, pressure and the development of tropical weather systems.
When something changes, I will add it here.
Sometimes my interpretation may turn out right.
Sometimes the atmosphere will remind us just how complicated it is.
And that is precisely what makes weather fascinating.
The objective isn't simply to predict rain. It is to understand why the sky behaves the way it does.
SECTION 2
The 2026 El Niño Watch
Latest Observations, Model Forecasts and Climate Interpretations
This section documents the evolving conditions across the Pacific and Indian Oceans during 2026.
The observations are organised in reverse chronological order, with the most recent developments appearing first.
The distinction between observed conditions, model projections and possible climatic implications is particularly important.
16 October 2026: Strong El Niño Signals, Positive Indian Ocean Dipole and Implications for Tamil Nadu's Northeast Monsoon
Analysis of observations and forecasts available during 10–12 October 2026, based on Australian Bureau of Meteorology and NOAA climate products.
The Oceans Are Changing. What Might This Mean for Our Monsoon?
As Tamil Nadu enters one of its most important rainfall seasons, significant climate signals are emerging thousands of kilometres away.
The ocean temperature observations and seasonal forecasts examined here reveal pronounced warming across the equatorial Pacific, a positive Indian Ocean Dipole, and evolving atmospheric circulation patterns.
These developments are important because the oceans do not function independently of the atmosphere.
They exchange heat and moisture, influence atmospheric circulation, and can change the likelihood of rainfall, drought and extreme weather across distant regions.
The question is not simply whether El Niño is developing.
It is how multiple climate drivers might interact during the coming months.
1. The Pacific Ocean: An Unusually Strong Warming Signal
One of the most striking features of the Australian Bureau of Meteorology's ACCESS-S2 forecast is the magnitude of projected relative warming across the central and eastern equatorial Pacific.
The model forecasts the following Relative Niño index values:
MonthR-Niño 3.4R-Niño 3R-Niño 4November 2026+3.7°C+4.6°C+1.2°CDecember 2026+3.7°C+4.9°C+1.0°CJanuary 2027+3.5°C+4.5°C+1.0°CFebruary 2027+3.0°C+3.6°C+1.1°CMarch 2027+2.4°C+3.0°C+1.0°C
Source: BoM ACCESS-S2 model forecast, initialised 10 October 2026. These values are forecasts, not observations.
The difference between the regions is particularly noteworthy.
The Niño 3 region, located in the eastern equatorial Pacific, shows considerably greater projected relative warming than Niño 4 in the western-central Pacific.
This suggests that the model expects the strongest relative warming to remain concentrated farther east.
The forecast sea-surface temperature maps for November, December and January reinforce this pattern, displaying a prominent warm anomaly extending across the central and eastern equatorial Pacific towards South America.
Why does this matter?
During El Niño, changes in Pacific Ocean temperatures can alter the location of tropical convection, influence the Walker Circulation and affect atmospheric circulation across the globe.
However, an important qualification is necessary.
In September 2025, BoM replaced its traditional Niño indices with Relative Niño indices. These account for warming relative to the broader tropical ocean rather than simply measuring local temperature departures from a historical average.
Consequently, a forecast R-Niño 3.4 value of +3.7°C cannot automatically be classified using historical thresholds developed for traditional Niño indices.
The forecast indicates an exceptionally large positive relative temperature anomaly, but historical comparisons and claims of a record-breaking El Niño require a consistent index and supporting atmospheric observations.
2. The Indian Ocean Dipole: Positive Conditions Have Emerged
The Indian Ocean Dipole describes the difference in sea-surface temperatures between the western and eastern tropical Indian Ocean.
A positive IOD occurs when the western Indian Ocean becomes warmer relative to the eastern Indian Ocean.
The BoM weekly observations show that the IOD index reached +0.88°C for the week ending 11 October 2026, exceeding the positive-IOD threshold of +0.4°C.
The longer historical chart also shows that the index has fluctuated considerably over recent years, including strongly positive and negative periods.
What do the models forecast?
MonthForecast IOD IndexNovember 2026+1.1°CDecember 2026+0.8°CJanuary 2027+0.4°CFebruary 2027+0.1°CMarch 2027+0.1°C
Source: BoM ACCESS-S2 forecast, 10 October 2026.
The model therefore suggests positive IOD conditions during November, followed by a gradual weakening towards neutral conditions.
This is particularly relevant because the IOD can influence rainfall patterns around the Indian Ocean basin, including parts of India, eastern Africa, Indonesia and Australia.
Historically, a positive IOD has sometimes moderated the adverse effects of El Niño on India's Southwest Monsoon.
However, the Northeast Monsoon is governed by a different seasonal circulation pattern, and the influence of a positive IOD cannot be interpreted in isolation.
3. Why the Combination of El Niño and Positive IOD Deserves Attention
The simultaneous presence of strong positive Pacific temperature anomalies and a positive IOD is one of the most interesting aspects of the current climate outlook.
Both patterns influence tropical rainfall and atmospheric circulation, although they operate through different ocean regions.
Their effects can interact.
For India, the outcome depends on the season, the geographical region and the behaviour of other climate drivers.
A positive IOD does not automatically cancel the influence of El Niño.
Likewise, a strong El Niño signal does not automatically mean that all regions of India will experience deficient rainfall.
Understanding the interaction requires monitoring both ocean temperatures and atmospheric responses.
4. Tamil Nadu: Why the Northeast Monsoon Is Different
Tamil Nadu occupies a distinctive position in India's monsoon system.
While much of the country receives most of its rainfall from the Southwest Monsoon between June and September, Tamil Nadu depends heavily on the Northeast Monsoon from October through December.
This seasonal difference is critical.
El Niño is commonly associated with an increased probability of weaker Southwest Monsoon rainfall across India.
Yet some historical studies have identified a tendency towards enhanced Northeast Monsoon rainfall over southeastern India during certain El Niño events.
This does not mean every El Niño brings heavy rainfall to Chennai.
Tamil Nadu's rainfall also depends on the strength and position of the monsoon circulation, moisture transport from the Bay of Bengal, low-pressure systems, cyclonic disturbances and intraseasonal atmospheric variability.
The current climate charts therefore provide important background signals, but they are not sufficient to predict the amount of rainfall Chennai will receive during October, November or December 2026.
What can reasonably be inferred?
The strong positive Pacific temperature forecasts and positive IOD suggest that the larger tropical climate system may be undergoing significant changes.
These developments warrant close monitoring during the Northeast Monsoon.
5. The Madden–Julian Oscillation: A Shorter-Term Climate Influence
The Madden–Julian Oscillation, commonly called the MJO, is a moving pattern of enhanced and suppressed tropical cloudiness and rainfall.
Unlike El Niño, which develops over several months, the MJO typically evolves over a period of weeks.
It can influence tropical rainfall, monsoon activity and the conditions that support the development of low-pressure systems.
The forecast initialised on 12 October 2026 shows a wide spread among ensemble members.
The forecast mean moves through different phases, but much of the projected activity remains relatively close to the central region of the phase diagram, indicating periods of weak or uncertain MJO activity.
The large spread among individual forecast members also suggests that confidence in its precise future evolution is limited.
For Tamil Nadu, this means that the MJO should be monitored as a potentially useful short-term influence rather than treated as a definitive rainfall forecast.
6. What the Observed Sea-Surface Temperature Maps Reveal
The NOAA Coral Reef Watch map dated 12 October 2026 displays a prominent band of positive SST anomalies along the equatorial eastern Pacific.
This observed pattern broadly supports the presence of substantial Pacific warming.
The September 2026 and 5–11 October 2026 Indian Ocean maps also show widespread areas of warmer-than-average sea-surface temperatures.
However, the Indian Ocean temperature pattern is spatially uneven, with cooler-than-average areas around parts of the Maritime Continent and nearby waters.
This matters because climate indices summarise temperature differences across large regions, whereas actual ocean temperature maps reveal the geographical structure of those differences.
Warm ocean water can provide moisture and energy to the atmosphere, but it does not independently determine rainfall.
The formation of rain-bearing systems also depends on atmospheric instability, winds, vertical wind shear, moisture transport and regional circulation.
7. What Might Happen Across Different Regions?
The implications of El Niño and a positive IOD vary substantially by location.
Australia and Indonesia: El Niño commonly increases the likelihood of dry conditions across parts of these regions. A positive IOD can also contribute to reduced rainfall in parts of Australia and Indonesia, particularly during its active season.
Western South America: Warmer eastern Pacific waters can increase the likelihood of heavy rainfall along parts of coastal Peru and Ecuador, depending on the season and regional atmospheric conditions.
Southern Africa: El Niño is often associated with an increased risk of below-normal summer rainfall in parts of southern Africa.
North America: El Niño can influence winter atmospheric circulation, changing the likelihood of wet or dry conditions across different parts of the United States and Canada.
India: The effects depend strongly on the monsoon season. A relationship observed during the Southwest Monsoon cannot automatically be applied to the Northeast Monsoon.
These are broad climate tendencies rather than guaranteed outcomes.
8. Significant Signals, but Important Uncertainties
The climate charts available in mid-October 2026 suggest that the tropical Pacific and Indian Ocean deserve close attention.
The models project exceptionally strong positive Relative Niño anomalies through late 2026, particularly in the eastern equatorial Pacific.
At the same time, observations show a positive IOD, with forecasts suggesting that it may persist into November before gradually weakening.
These signals are scientifically important because they can influence large-scale atmospheric circulation and rainfall probabilities across different regions.
For Tamil Nadu, however, the most important question remains how these global climate drivers interact with the Northeast Monsoon and regional Bay of Bengal weather systems.
5 October 2026 — The Pacific Is Getting Very Interesting
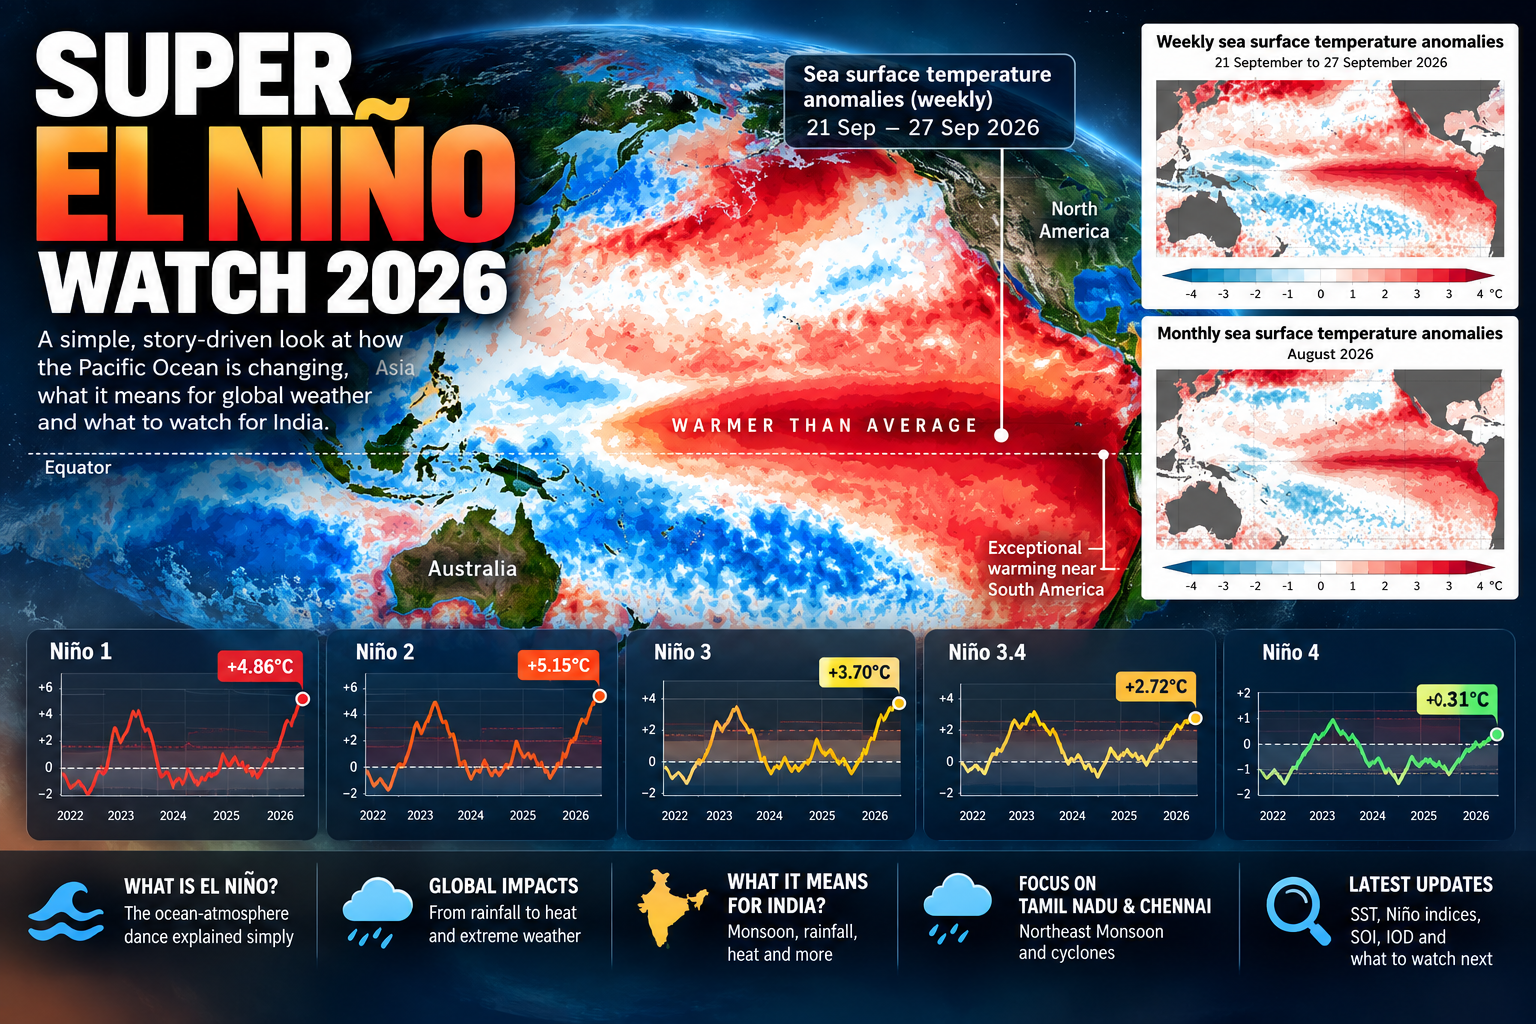
Look at these numbers from the week ending 27 September 2026.
Pacific RegionRelative SST AnomalyNiño 1+4.86°CNiño 2+5.15°CNiño 3+3.70°CNiño 3.4+2.72°CNiño 4+0.31°C
Source: Australian Bureau of Meteorology, weekly Relative Niño indices.
Don't worry if Niño 1, Niño 2 and Niño 3.4 mean nothing yet. I have explained these monitoring regions in Section 1.
For now, notice something simple.
The eastern Pacific is extraordinarily warm relative to its usual state and the broader tropical ocean reference used in these indices.
The progression is fascinating:
Niño 4 (+0.31°C) → Niño 3.4 (+2.72°C) → Niño 3 (+3.70°C) → Niño 2 (+5.15°C)
In other words, the relative warming becomes dramatically stronger as we travel eastward toward South America.
And the sea-surface-temperature map makes this beautifully visible.
A long tongue of unusually warm water stretches across the equatorial Pacific, becoming particularly intense toward Ecuador and Peru.
But ocean temperature is only half of the El Niño story.
Another number caught my attention.
SOI: Around −20.5
SOI stands for Southern Oscillation Index.
Think of El Niño as a dance between two partners:
The ocean and the atmosphere.
Niño 3.4 tells us mainly what the ocean is doing.
The SOI helps tell us what the atmosphere is doing.
A strongly negative SOI is characteristic of an El Niño-type atmospheric circulation.
So when we see something like:
Relative Niño 3.4: +2.72°C
SOI: Around −20.5
The story becomes much more interesting.
The ocean isn't warming alone. The atmospheric indicator is also showing an El Niño-like response.
That interaction between ocean and atmosphere is what allows El Niño to influence weather far beyond the Pacific.
September 2026 — A Dramatic Acceleration
The late-September readings were particularly striking.
The strongest relative warming was concentrated toward the eastern Pacific, rather than being distributed uniformly across the tropical Pacific.
The atmospheric indicators were also noteworthy.
The SOI reading was strongly negative, while the wind and convection patterns examined during this period showed El Niño-like characteristics.
Taken together, the oceanic and atmospheric signals suggested a developing coupled climate event rather than an isolated patch of unusually warm ocean.
Whether the event ultimately deserves the informal description “Super El Niño” should be judged from sustained conditions over the coming months, not from one exceptionally high weekly reading.
The Indian Ocean Was Changing Too
In June, the IOD index was approximately:
IOD = −0.34°C
This indicated slightly negative conditions.
By late September, the IOD had reached approximately:
IOD = +0.76°C
This was above BoM's +0.4°C positive-IOD threshold.
The combination was particularly interesting:
Strong positive Pacific temperature anomalies + developing positive IOD conditions.
That combination matters for India.
El Niño generally tends to suppress India's Southwest Monsoon, whereas a positive IOD can sometimes counteract part of that influence.
So I would not look at a Relative Niño 3.4 reading of +2.72°C and conclude:
“India must now become extremely dry.”
Climate doesn't work that linearly.
As of the first week of October, the equatorial warm tongue appeared more intense, more continuous and more concentrated toward the eastern Pacific.
This wasn't merely one Niño index jumping around for a week.
There was a coherent large-scale ocean temperature pattern behind it.
Seasonal models were also projecting further strengthening, although the eventual intensity, duration and historical ranking of the event remained uncertain.
The possibility of an exceptionally strong event deserves attention, but the model forecasts should not be treated as observations or as proof of a record-breaking El Niño.
August 2026 — The Warm Tongue Becomes Obvious
By August, the Pacific sea-surface-temperature anomaly maps had changed considerably.
A broad region of above-average water was visible along the equatorial central and eastern Pacific.
The warm anomaly wasn't simply a small hot patch near South America.
It was developing into a large-scale structure across the tropical Pacific.
The bathtub was changing.
This was an important stage in monitoring the evolution of the Pacific temperature pattern.
The next question was whether the atmospheric circulation would respond consistently to the changing ocean conditions.
June 2026 — Something Was Beginning
When I looked at the data in early June, the Relative Niño 3.4 index was approximately:
Relative Niño 3.4 = +0.81°C
The Pacific was beginning to show a clear El Niño-like warming signal.
At that stage, my interpretation was essentially:
“The Pacific appears to be moving toward El Niño, but let's watch whether the atmosphere joins the ocean.”
At the same time, the Indian Ocean Dipole index was around:
IOD = −0.34°C
That was near neutral, with a slight negative tendency.
Nothing about that snapshot justified jumping immediately to dramatic conclusions.
So we watched.
And over the following months, the evolving Pacific and Indian Ocean patterns became increasingly interesting.
Sources and Data Attribution
The observations and model interpretations in this climate diary are based on the following products and datasets:
Australian Bureau of Meteorology — ACCESS-S2 Relative Niño 3.4, Niño 3 and Niño 4 forecasts, including the 10 October 2026 model run.
Australian Bureau of Meteorology — Indian Ocean Dipole observations and forecasts, including the weekly value to 11 October 2026.
Australian Bureau of Meteorology — Southern Annular Mode daily index and ensemble outlooks, 10–12 October 2026.
Australian Bureau of Meteorology — Sea-surface temperature observations for September 2026 and 5–11 October 2026.
Australian Bureau of Meteorology — Global sea-surface temperature forecasts for November 2026 to January 2027.
Australian Bureau of Meteorology — MJO phase-space forecasts and tropical wave diagnostics, 12 October 2026.
NOAA Coral Reef Watch — Daily 5 km sea-surface temperature anomalies, 12 October 2026.
Official reference websites:
Australian Bureau of Meteorology: https://www.bom.gov.au/climate/
NOAA Coral Reef Watch: https://coralreefwatch.noaa.gov/
India Meteorological Department: https://mausam.imd.gov.in/
Scientific Note
This article documents climate observations, numerical model forecasts and independent interpretations of the supplied climate charts.
Model projections are not observations, and exceptionally high forecast temperature anomalies do not automatically establish the final strength or historical ranking of an ENSO event.
This article should not be interpreted as an independently verified declaration of official ENSO status or as a rainfall forecast for Tamil Nadu.
Forecasts, interpretations and climate outlooks remain subject to revision as new observations become available.